
Peer-reviewed research published in Expert Systems with Applications (2023), co-authored with Ratko Grbić.
Full title: “Automatic vision-based parking slot detection and occupancy classification.” The algorithm is called APSD-OC.
Most vision-based parking systems need a human to draw every parking slot onto the camera image before they can work. We removed that step. APSD-OC finds the slots by itself, from nothing but a series of images of the lot, and then classifies each one as occupied or vacant. On the PKLot UFPR05 camera it locates 43 of 44 slots with a single false positive, and the occupancy classifier holds an AUC above 0.99 across every train/test combination we tried.
Why vision-based parking systems need manual labeling
Parking guidance information (PGI) systems tell drivers where the free spaces are. The straightforward way to build one is a sensor in every bay, but that means buying, installing and maintaining hardware per slot. A camera watching the lot is far cheaper, especially since many car parks already have surveillance cameras.
The catch is that almost every camera-based system needs each slot’s position marked by hand in the image first. Those annotations are what the classifier crops. That is tedious across many cameras, and worse, it is fragile: change the camera angle, zoom it, service it or replace it, and the whole labeling job starts again.
Finding the slots from the detections themselves
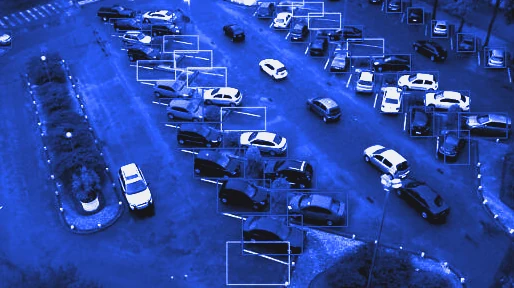
The core assumption is simple: drivers are forced to park inside the markings, so a parking slot is just a place where vehicle detections keep happening.
Run a vehicle detector across a series of images taken over time, and clusters of detections build up exactly where the slots are. The slots emerge from the data instead of being drawn on top of it.
Making that work takes four steps.
1. Detect vehicles. YOLOv5 over each image, keeping only the car and truck classes at a confidence threshold of 0.5. In practice the camera is sampled about every 5 minutes.
2. Flatten the perspective. Detections near the camera are spread further apart than identical slots at the back of the lot, which wrecks clustering. So the detection centres are mapped to a bird’s eye view through a 3x3 homography.
Estimating that homography is normally its own manual chore: other work picks four points in the camera view and matches them against a top-down image pulled from Google Earth. Instead we reuse the CNN from Abbas and Zisserman (2019), which regresses the homography from just four parameters, the vertical vanishing point and the horizon line. It was trained on synthetic urban scenes generated in the CARLA simulator with randomised camera height, field of view, roll and tilt. We average its output over ten random images of the lot. No top-down reference image, no manual point picking.
3. Cluster the detections. DBSCAN on the transformed centres. Density-based clustering suits this because slot clusters are dense and arbitrary in shape, while passing cars and brief illegal stops fall out as noise rather than forming clusters.
4. Project back. Surviving cluster centres are mapped to the camera view with the inverse homography, and each slot’s area is taken as the mean of the bounding boxes in its cluster.
Separating real slots from illegal parking
This is the part I find most satisfying, and it needs no extra model.
For each cluster, compute the sum of the standard deviations of its detection centres in x and y. Call it the spread. Then discard any cluster whose spread falls outside the 1.5 IQR range, and it turns out both tails are wrong in different ways:
- Too much spread means a spot where cars park at inconsistent positions, which is what a parking violation looks like: an entrance, a verge, a stretch of kerb.
- Too little spread means one car sat in one position for a long time, or the location has simply not seen enough different vehicles to prove it is a slot.
Only the middle survives. Regular slots have tight, repeatable clusters because the markings force them to.
One manual parameter remains, which is the number of slots visible in the frame. That is far easier to supply than the camera angle, the intrinsics or a homography matrix, which is what comparable methods ask for.
Slot detection accuracy across five cameras
Evaluated on PKLot (12,417 images, 695,900 annotations, 3 views) and CNRPark-EXT (4,278 images, 144,965 annotations, 9 views). Slots were counted manually for evaluation, because neither dataset annotates every regular slot.
Using all available images:
| Camera | Slots | Precision | Recall |
|---|---|---|---|
| PKLot UFPR05 | 44 | 97.73% | 97.73% |
| PKLot PUCPR | 170 | 95.76% | 92.94% |
| CNRPark-EXT C2 | 11 | 100% | 100% |
| CNRPark-EXT C4 | 41 | 100% | 95.12% |
| CNRPark-EXT C3 | 26 | 96.15% | 96.15% |
The trend that matters is that recall climbs with more images, because more distinct cars must park in a slot before DBSCAN’s minPoints is satisfied. Precision stays roughly flat as data grows, which is the evidence that the approach genuinely resists passing vehicles and violations rather than just averaging them away. Seven of the nine CNRPark-EXT cameras reach 100% precision, in each case because those views contain almost no parking violations.
Occupancy classification against CarNet and mAlexNet
A ResNet34 pretrained on ImageNet, fine-tuned with a learning-rate finder and a 1cycle schedule with discriminative learning rates. Training and test images are split by date, so images before a cut-off train and images after it test, which prevents the same car leaking across both sets.
Against CarNet and mAlexNet on PKLot, our classifier takes the best result in seven of nine train/test combinations, with AUC above 0.99 in every single one. The clearest win is the hardest transfer: trained on PUCPR and tested on UFPR04, a very different camera perspective, it reaches 98.62% against CarNet’s 94.40%.
Generalisation was probed two more ways on CNRPark-EXT:
- Viewpoint. Train on one camera, test on all the others. Above 95% in every case bar one, where training on C8 (a front view) and testing on C1 (a side view) drops to 92.79%.
- Weather. Above 98% in all six sunny/overcast/rainy transfers, including 99.02% training on sunny and testing on rain.
Where it falls short
Two honest limits.
Full cross-dataset transfer is not our best result. Train on CNRPark-EXT and test on PKLot, or vice versa, and CarNet beats us. Our advantage shows up in per-lot and per-viewpoint generalisation, not in wholesale dataset transfer.
The fixed-camera assumption is real, and it broke. Partway through the PKLot UFPR04 recording the camera physically moved. Since the whole method assumes a static viewpoint while detections accumulate, the assumption no longer held, so we withheld the 80% and 100% results for that camera rather than report numbers built on a broken premise.
Future work: infer the number of slots from the shape of the detection distribution, removing the last manual parameter, and exploit the fact that slots sit in regular spatial relationships to sharpen detection further.
Read the paper → · Datasets: PKLot · CNRPark-EXT